
The City of Watertown recently embarked on a comprehensive capital improvement plan to rehabilitate their aging storm sewer system. In order to tackle such a significant project, the City knew they needed to start with accurate data and a thorough understanding of their underground infrastructure. They also knew that surveying their 3,000+ storm sewer system structures using traditional survey methods would be costly and place a tremendous demand on their staff.
The City partnered with R/M to complete a full storm sewer inventory, including surface and subsurface data collection, using state of the art technology that will allow the City to execute their long-term storm water system upgrades in a strategic, cost-effective manner.
FIGHTING SMARTER
To inventory the City’s storm sewer system, R/M first conducted a GPS survey to collect accurate locations for the City’s above-ground structures. Once the GPS survey concluded, our team used a laser scanning device to systematically scan all of the City’s manholes and collect invert data and condition assessment imagery.
Laser Manhole Scanning and Inspections

Tripod lowering the scanner (circled in yellow) into storm manhole

Exterior view of point cloud - typical storm manhole
The laser scanner broadcasts throughout the structure, and each point hit by the laser is recorded and assigned an XYZ coordinate location.

Left: Exterior view of point cloud; Right: Interior view of point cloud showing access steps and inlet pipe
The laser scanning device produces high-definition, 360 degree panoramic imagery along with a virtual recreation of the structure in the form of a digitized point cloud.

Left: Panoramic imagery of interior scan; Right: Corresponding point cloud data of interior
The laser scanner collects all of the data necessary to develop a 3D point cloud of the structure. The elevations of the inlets and outlets are calculated and can be easily checked, so the City receives complete, accurate system data. This technology eliminates the room for error left by the traditional survey process, which requires a team of surveyors to lower a rod into the manhole, hit each invert, calculate the inverts, draw a sketch of the invert locations, and then relay that data to a CAD technician for processing.
With this technology, you are effectively bringing the structure out of the field and on to your computer screen.

Scan data showing inverts at bottom of structure and invert measurement from point cloud (elevations have been adjusted to project datum)
The scan provides a fully immersive 3D environment that effectively allows the City to perform their own walk through of the pipe via the digital recreation of the structure. They can pan, zoom, and scan anywhere in the point cloud.

Scan of large sewer main with offset manhole

Point clouds can be visualized based on true color or intensity of laser returns to illuminate more detail

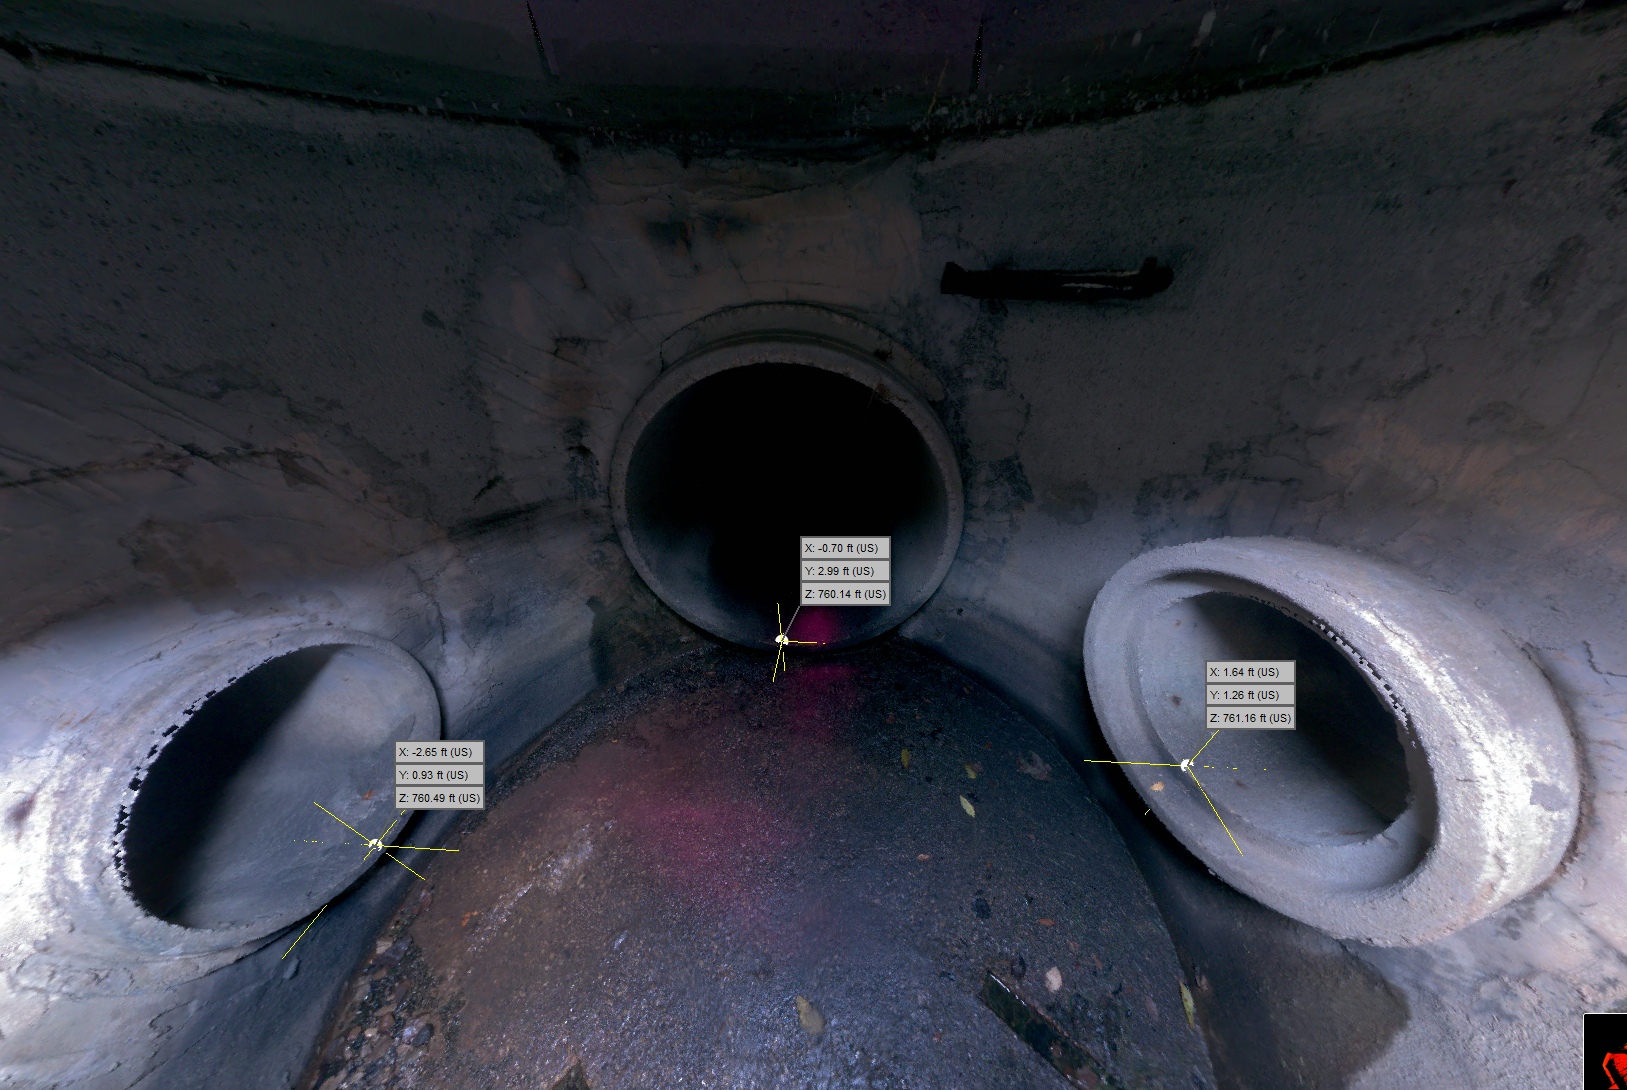
High-resolution panoramic imagery with invert measurements shown (elevations adjusted to project datum)
The City will also use the high-resolution, panoramic imagery for structure condition inspection and documentation.

High-resolution panoramic imagery for condition inspection/documentation (scanner is equipped with flash)
Putting the Data to Work
To efficiently track the City’s survey progress and manage the massive amount of data collected throughout the inventory, R/M developed a GIS-based storm sewer inventory application. This app allowed the City to monitor inventory updates in real time and seamlessly transfer survey data to their GIS. It also equipped the City with the tools necessary to immediately begin the next steps of their long-term storm sewer system planning: hydraulic modeling.

Example of storm sewer inventory progress update in GIS app
Learn More
Our storm water experts have decades of experience helping municipalities successfully rehabilitate their storm sewer systems. To learn how our experts can help your community fight smarter against aging infrastructure, please contact us today.